3 Current Situation and Problems of Niseko Town 3: 5
3-5 Industrial Structure of Niseko Town
The proportion of employed people in the total population was on a downward trend, 54.7% in 1965, 53.6% in 1972, 53.3% in 1965, 55.8% in 1985, 2 in Heisei 2 It is on a recovery trend with 55.4% in 1995 and 54.3% in 1995.
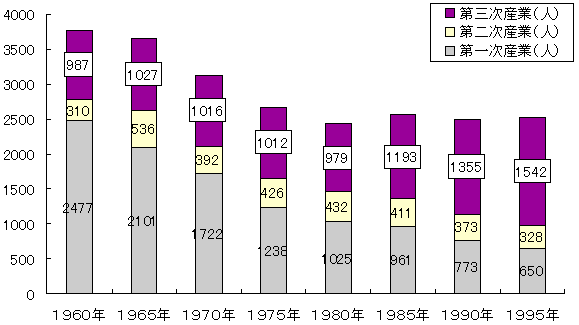
The working population by industry decreased by 33.2% in the total number of working people during the 35 years from 1954 to 1995. In particular, primary industrial workers decreased significantly, mainly to agricultural workers, to 73.7%, while the composition ratio also decreased from 65.6% to 25.8%, whereas the number of tertiary industries, mainly tourism-related industries, , There is a tendency to increase in the midst of a decrease in the total number of employed workers, and the composition ratio has increased from 26.2% to 61.2%, and since the 1970s the tertiary industry has exceeded the primary industry. The linkage between agriculture and sightseeing, which is the core industry, is weak, and it is considered important to promote these collaborations as a direction for revitalizing the regional economy. In 1953, the number of secondary industrial workers was 310, the composition ratio was 8.2%, the number of employees in 1997 was 328, and the composition ratio was slightly increased to 13.0%.
The working population by industry decreased by 33.2% in the total number of working people during the 35 years from 1954 to 1995. In particular, primary industrial workers decreased significantly, mainly to agricultural workers, to 73.7%, while the composition ratio also decreased from 65.6% to 25.8%, whereas the number of tertiary industries, mainly tourism-related industries, , There is a tendency to increase in the midst of a decrease in the total number of employed workers, and the composition ratio has increased from 26.2% to 61.2%, and since the 1970s the tertiary industry has exceeded the primary industry. The linkage between agriculture and sightseeing, which is the core industry, is weak, and it is considered important to promote these collaborations as a direction for revitalizing the regional economy. In 1953, the number of secondary industrial workers was 310, the composition ratio was 8.2%, the number of employees in 1997 was 328, and the composition ratio was slightly increased to 13.0%.
Graph 9 Trends in Employed Population by Industry
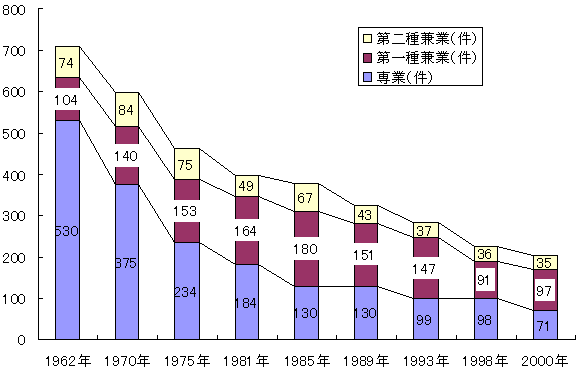
Graph 10 Trends in the number of farmers
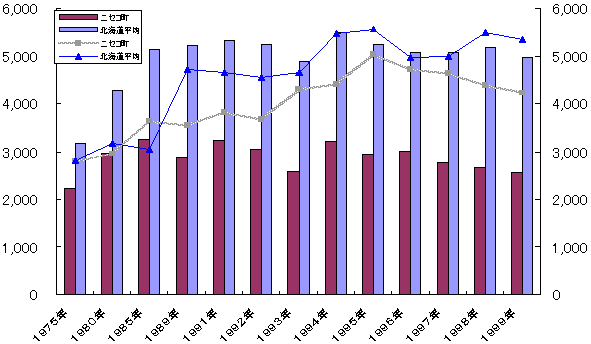
Graph 11 Agricultural crude production value (bar chart, unit: million yen) and
Change in agricultural income (line graph, unit: thousand yen) per farm house production
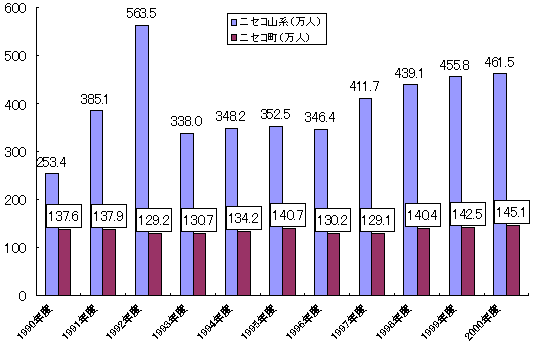
Graph 12 Trends in number of tourists
Inquiries
- Niseko Town Hall
- TEL:0136-44-2121
- FAX:0136-44-3500